
Bitcoin [BTC] has continued its sluggish sideways movement that is representative of the market in the past week, with the sharp uptrend in its price soon finding the momentum dying down. Investors are looking on the horizon for another break soon, with the indicators showing that the movement might occur soon.
1 hour
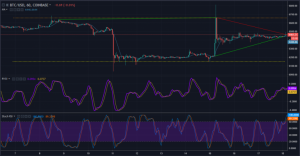
The $6625 – $6660 uptrend is acting as a resistance for the price, with the $6210 – $6445 uptrend providing a support for the price. The $6660 – $6465 downtrend is in power currently, as the price dropped after the sharp upwards hike.
The Relative Vigor Index is moving upwards, demonstrating a bullish crossover of the MA over the signal line.
The Stochastic RSI is in the overbought zone and may represent an entry point considering that the price is in a downtrend. If the uptrend into overbought is short-lived, it may represent a buy signal for the coin.
1 Day
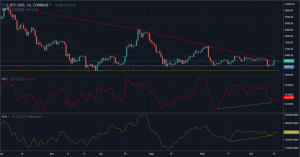
The $9800 – $8390 – $6440 downtrend is in power since May, with support lines at $5850 and $6145.
The Parabolic SAR indicator is bullish, as indicated by the presence of the indicator under the candlesticks.
The Ultimate Oscillator is showing a bullish divergence with the dominant trend indicating the price might move upwards.
Ease of Movement is slowly moving upwards, representing a bullish reversal moving with ease upwards.
The price of Bitcoin is set to find newer highs and might test set resistance levels at $6660 and $6800. Support levels are set at $6000 and $5700 as the bottom over the long term, with a generally bullish outlook.


Comments are off this post!