After a dramatic two weeks for Bitcoin and the wider cryptocurrency market the biggest question for many traders and investors is could this be the bottom? Bitcoin has tumbled again today as the market continues to see further downward movement shortly after breaking several areas of market support.
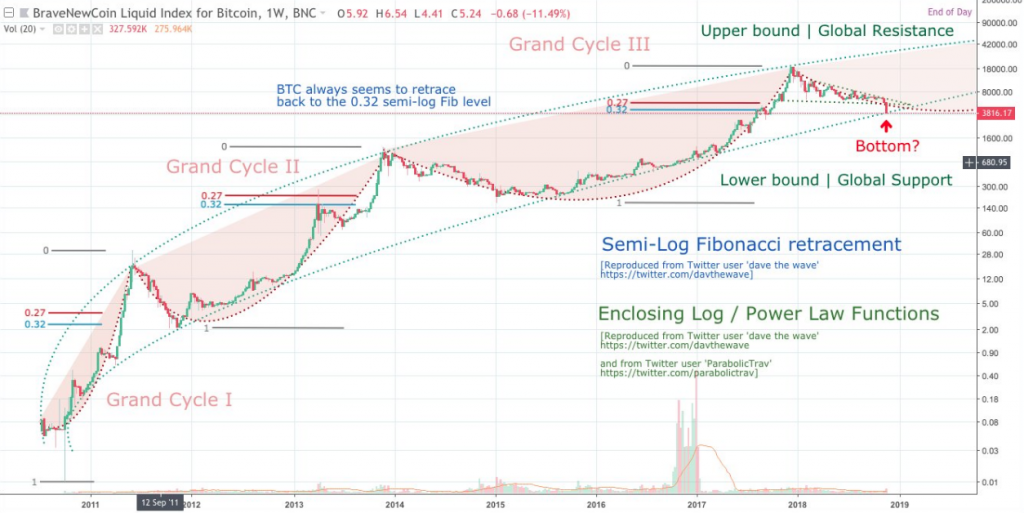
This drop below support is starting to look like market capitulation. Over the last two weeks, after several tests of support, the bottom finally gave out and bitcoin dropped down through multiple support levels. With little to no relief in sight for the bulls, many early buyers are now finding their investments underwater as the market continues to head down toward its macro 78% Fibonacci retracement values.
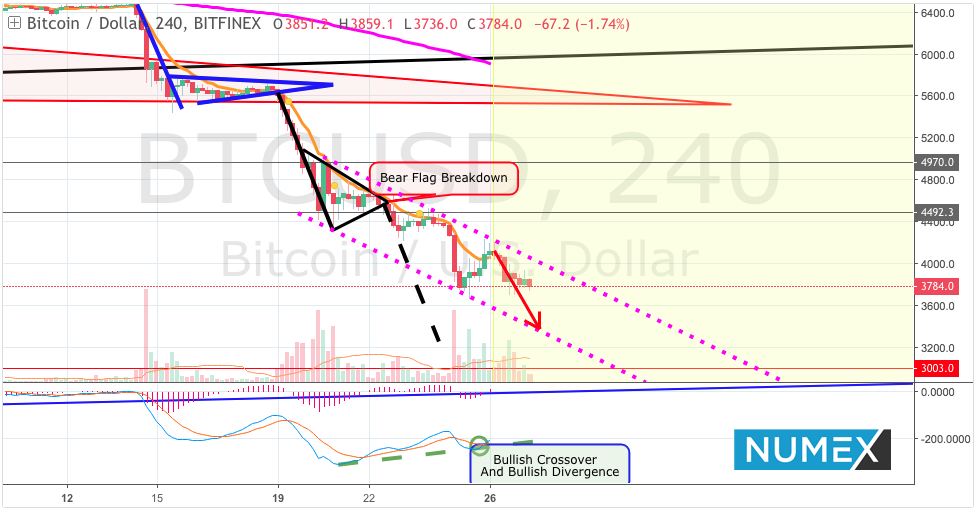
RSI is also turning lower after recently hitting the overbought zone, which might mean that selling pressure is returning. Similarly stochastic is topping out and is pointing downwards so bitcoin might follow suit. However, if buyers are able to wrestle through these bearish signals, bitcoin might have a shot at reversing from this slide.
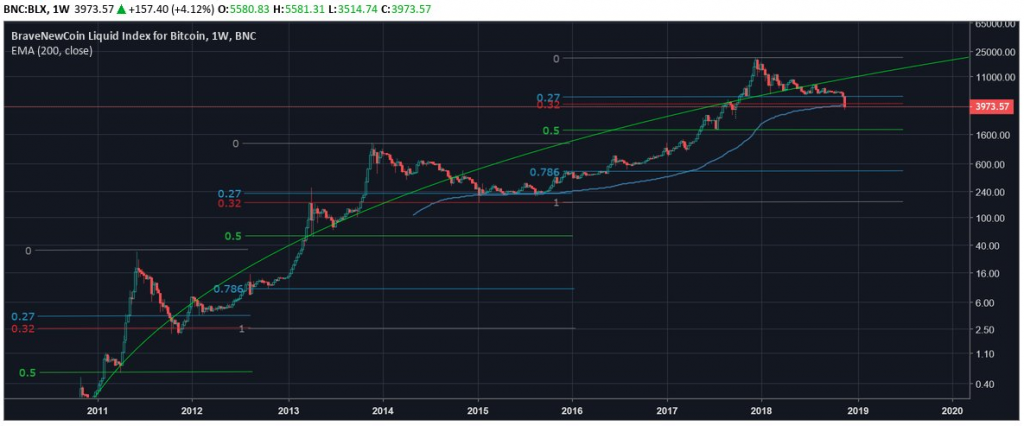
Bitcoin fell below its 200-week exponential moving average (EMA) of $4,180 last week, marking the first break of the crucial support since August 2015. Back then, BTC was changing hands around $220, according to Bitstamp data.
In general, the 50- and 200-day EMAs are used as signals of long-term trends. When a stock prices crosses its 200-day moving average, it is a technical indicator that a reversal has occurred. With Bitcoin the 200 EMA has been significant indicator that a reversal is about to take place.
There are several indicators that are pointing to signs that we are close the bottom of bitcoin price.
The Elliott impulsive wave, which goes with the main trend, always shows five waves in its pattern. On a smaller scale, within each of the impulsive waves, five waves can again be found. In this smaller pattern, the same pattern repeats itself over and over. These ever-smaller patterns are labeled as different wave degrees in the Elliott Wave Principle. At the moment according to this pattern the 5 wave has a target of around $3,000.
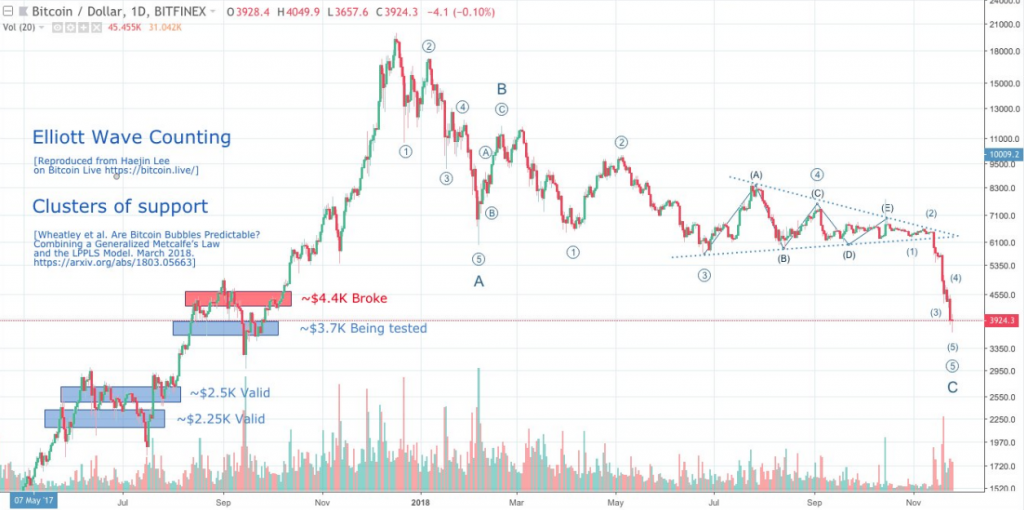
This coincides with the area where the 200 EMA is at the moment. After the Roger Ver / Jihan Wu /CSW debacle, which has probably been the catalyst for this latest severe market drop in BTC price, we might just see price move sideways into and along the curve over the next six months. This 53 EMA on the monthly chart is the 200 EMA on the weekly chart.
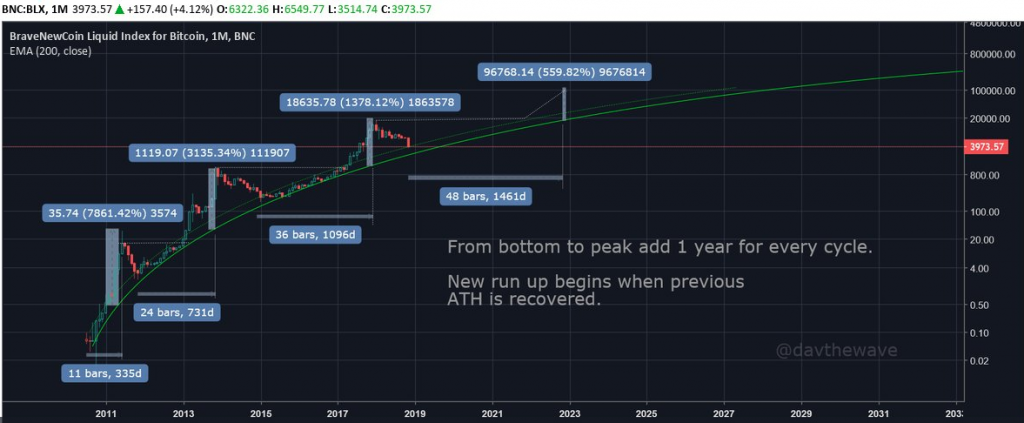
For a long term technical analysis we can look at the log curve and also the history of bitcoin price action which shows and increasing time span between the bottoms and peaks with roughly an extra year being added for each cycle. Usually a new run up begins when the previous All Time High has been reached. From this chart it appears this will be in Q2 2021.
A break below the 200-week EMA could prove costly as the next major support is seen at $3,130 – the widely followed 200-week simple moving average.


Comments are off this post!