When the Bitcoin protocol began running in January 2009, about 50 new bitcoins were produced every 10 minutes from “miners” verifying a new block of bitcoin transactions on the network. The protocol is programmed so that every 210,000 blocks mined, or about every four years, the reward given to Bitcoin miners for processing transactions is cut in half. This system will continue until around 2140. At that point, miners will be rewarded with fees for processing transactions that network users will pay. These fees ensure that miners still have the incentive to mine and keep the network going.
This events are called “halvings” and the most recent halving occurred on May 11, 2020. The first cycle, which started in January 2009, had 50 new bitcoins being issued every 10 minutes for solving a block. The first halving occurred in November 2012, and from that point on, miners received 25 coins for solving a block. The second halving occurred in July 2016, and from there the reward fell to 12.5 new coins per block. The third halving just occurred in May 2020, and so the reward is now just 6.25 coins per new block and you could say that we are now in the fourth cycle.
When Bitcoin was first unleashed on the world in 2009, the reward for “mining” a new block was 50 bitcoin. After the most recent halving in May, the reward is now down to 6.25 bitcoin per block.
This reward will continue to get cut in half roughly every 4 years until the very last (fraction of) bitcoin is mined sometime in 2141. Although it will take another 120 years for the very last bitcoin to be mined, over 99% of the total supply will be mined by the end of 2034!
Also read: Empire.io Casino Review
Unlike fiat currencies which are getting less scarce over time, Bitcoin is getting more scarce over time.
The price of bitcoin has historically performed extremely well during the 12-18 months after launch and after the first two halvings. The reduction in new supply of coins, in the face of constant or growing demand for coins does the old supply meet demand thing and price goes up.
In the period of 12 to 24 months after launch and the same period of time after subsequent halvings, money flows into the reduced flow of coins, and the price goes up due to this restricted supply. Then after a substantial price increase, momentum speculators get on board, and then other people chase it and cause a mania, which eventually pops and crashes. Bitcoin enters a bear market for a while and then eventually stabilizes around an equilibrium trading range, until the next halving cycle cuts new supply in half again. At that point, if reasonable demand still exists from current and new users, another bull run in price is likely, as incoming money from new buyers flows into a smaller flow of new coins.
Stock-to-Flow Model
Monetary commodities have high stock-to-flow ratios, which refers to the ratio between the amount of that commodity that is stored and the amount of that commodity that is newly-produced each year. Stock represents the total supply in circulation and flow represents the amount of new supply per year that is coming into existence.
Base commodities like oil and copper have very low stock-to-flow ratios. Since they have a large volume relative to price, they are costly to store and transport, so only a handful of months of supply are stored at any one time.
Using gold as an example, there is estimated to be 190,000 tons of gold above ground (stock) and 3,260 tons of new supply coming onto the market (flow). By dividing 190,000 by 3,260, we arrive at a stock-to-flow (S2F) value of 58.3 which puts it near gold’s stock-to-flow ratio. In 2024, after the fourth halving, Bitcoin’s stock-to-flow ratio will be over 100.
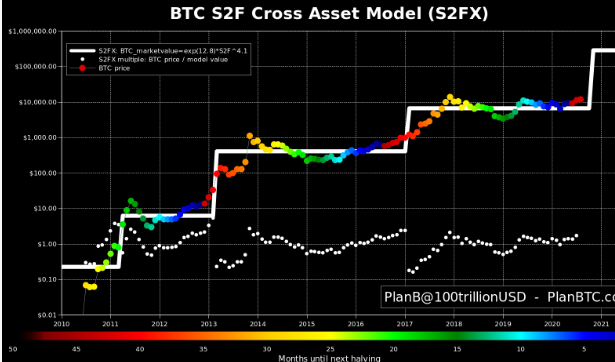
In 2019, a popular Bitcoin price model based on its stock-to-flow ratio was published by PlanB, a Dutch institutional investor. He has several versions of it, and multiple visualizations to display it, but here’s one of the representations:
Chart Source: PlanB, @100trillionUSD
The white line in the chart above represents the price model over time, with the notable vertical moves being the three halvings that occurred. The colored dots are the actual price of Bitcoin during that timeframe, with colors changing compared to their number of months until the next halving. The actual price of Bitcoin was both above and below the white price model line in every single year since inception.
As you can see, the previously-described pattern appears. In the year or two after a halving, the price tends to enjoy a bull run, sharply overshoots the model, and then falls below the model, and then rebounds and finds equilibrium closer to the model until the next halving.
Each halving cycle is less explosive than the previous one, as Bitcoin grows in market capitalization and maturity, but each cycle still goes up dramatically it just appears that the relative rate of increase is dropping.
PlanB’s model is bullish, suggesting a six figure price level within the next 18 months in this fourth cycle, and potentially far higher in the fifth cycle. It’s worth noting that a six figure price compared to the current $11,000 price level, is nearly 10x.
If Bitcoin reaches a $100k price level with 19 million coins in total, that would put its market cap at just under $2 trillion or more, above the largest companies in the world today. It would, however, still be much less then 1% of global net worth, and about a fifth of gold’s estimated market capitalization of $10 trillion, so it seems possible for Bitcoin to eventually reach that height if there is enough sustained demand for it.
While the PlanB model is accurate regarding what the price of Bitcoin did in the past, the extent to which it will continue to follow that model is an open question. During the first decade of Bitcoin’s existence, it went from a micro-cap asset with virtually no demand, to a relatively large asset with significant niche demand, including from some institutional investors. The demand increase has been very fast, but is slowing as price discovery matures. We are watching the birth of a new asset class over just the last 11 years and we must remember that it took gold and silver many thousands of years to arrive at the valuations they have today.
We should also remember that it’s easier for the network to go from $20 million to $200 million, which only requires a few thousand enthusiasts, than to go from $200 billion to $2 trillion, which will require mainstream retails and institutional adoption. Although we are seeing many signs of both, and they appear to be accelerating.
The unknown variable for how well Bitcoin will follow such a model over this halving cycle, is the demand side. The supply of Bitcoin, including the future supply at a given date, is known due to how the protocol operates. This model’s historical period involves a very fast-growing demand for Bitcoin on a percent gain basis, going from nearly no demand to international niche demand with some initial institutional interest as well.
The launch cycle had a massive gain in percent terms from virtually zero to over $20 per Bitcoin at its peak. The second cycle, from peak-to-peak, had an increase of over 50x, where Bitcoin first reached over $1,000. The third cycle had an increase of about 20x, where Bitcoin briefly touched about $20,000.
If demand grows more slowly in percent terms than it has in the past, the price is likely to undershoot PlanB’s model’s projections in the years ahead. However, we can’t rule out the bullish case if demand grows sharply and the global macro environment continues to deteriorate.
Game Theory Inherent In Bitcoin’s Design
A growing price tend to cause more demand, and vice versa. When investors see a bull market in Bitcoin, the demand increases dramatically, and when investors see a bear market in Bitcoin, the demand decreases. In addition, not all of the existing Bitcoin stock is permanently held; some of it is traded and sold.
What is fantastic about the transparency of the Bitcoin blockchain is that there is plenty of research and data regarding how long people hold their Bitcoin.
Glassnode published a chart recently that showed that over 60% of Bitcoin supply hasn’t changed addresses in the past year or more, and over 40% hasn’t moved in the past two years or more:
Chart Source: Glassnode
It’s not perfect measurement because a user can move their Bitcoin from one address to another, firms that hold custody of Bitcoin for others can complicate the issue, and some percentage of early-mined Bitcoin are most likely lost due to people losing their private keys. However, it does provide useful data nonetheless.
The additional fact that the new supply of Bitcoin gets cut in half roughly every four years rather than reduced by a smaller fixed amount each year like in the simplistic model, represents pretty smart game theory inherent in Bitcoin’s design. This gives the protocol the best possible chance for successfully growing market cap and user adoption.
Bitcoin has a built-in 4-year bull/bear market cycle, similar to the natural cycle of a typical stock market. These 4 years give investors plenty of time to experience the mania and despair associated with a cycle like this, and will ultimately maximize the efficiency of it’s price discovery.
It turns out that professional investors are seeing the same risks and are starting to gain exposure to Bitcoin as a result. One of the most notable examples of this is billionaire/hedge fund manager Paul Tudor Jones. He recently announced that he has almost 2% of his net worth in Bitcoin.
Bitcoin Volatility Is Reducing Over Time
There has been a noticeable decline in volatility over Bitcoin’s existence. Since Bitcoin started from a tiny base and grew into a meaningful size, its volatility has been a feature, rather than a bug. In some years, it has been down over 80%, while in other years, it has gone up over 1,000%.
This feature makes it speculative for most people, rather than having a reputation as a reliable store of value that gold enjoys, since it’s relatively uncommon for gold to have a double-digit percent drawdown year, let alone a double-digit percent drawdown day like Bitcoin sometimes has.
If, over the next 5+ years, Bitcoin’s market capitalization becomes larger and more widely-held, its notable volatility can decrease, like a small-cap growth company emerging into a large-cap blue-chip company.
Bitcoin is still in the early adoption stage and is only a $200B asset. This means the price can fluctuate violently in the short-term. Just five months ago when COVID-19 began rocking the financial markets, Bitcoin’s price dropped 50% in a matter of days. However, the price recovered within a month, but it is now up more than 60% year-to-date.
In the meantime, Bitcoin’s volatility can be managed by using appropriate position sizes relative to an investor’s level of knowledge and conviction in the asset, and relative to their personal financial situation and investment goals.
Bitcoin’s volatility is not for the feint of heart, but then again, a 2% portfolio position in something is rarely worth losing sleep over even if it gets cut in half, and yet can still provide meaningful returns if it goes up, 5x or more.
Intentional Design
Bitcoin is a beautifully-constructed protocol and some say genius is apparent in its design, in the way it blends math, computer science, cyber security, monetary economics, and game theory.
Rather than just a fixed set of coins released to the public, or a fixed perpetual rate of new supply, or any other possible permutation that Satoshi could have designed, this is the specific method he chose to initiate, which is now self-perpetuating. Nobody even knows who Satoshi’s real identity is or if he’s still alive; it is the Bitcoin community that is now collectively responsible for its success or failure.
The regular halving events consistently reduce the flow of new coins, meaning that as long as there is a persistent user-base that likes to hold a lot of the existing coins, even if the annual new interest in Bitcoin from new buyers remains just constant (rather than growing), Bitcoin’s price is likely to rise in value over the course of a halving cycle. This in turns attracts more attention, and entices new buyers during the cycle.
The thought put into its architecture likely played a strong role for why Bitcoin reached relatively wide adoption and achieved a twelve-figure market capitalization, rather than come and go as a novel thing that a few cypherpunk programmers found fascinating.
Bitcoins death has been prematurely described or greatly exaggerated hundreds of times, and yet it continues to survive and thrive. Still growing, after 11 years of existence, most likely thanks in part to the halving cycles in addition to its first-mover advantage that helped it build the most computational security.
In addition to solving the challenging technical problems associated with digital scarcity and creating the first cryptocurrency, Satoshi also chose a smart set of timing and quantity numbers (out of a nearly infinite set that he could have chosen from, if not carefully thought out) to maximize the incentive structure and game theory associated with his new protocol.
There are arguments for how Bitcoin can change, like competitor protocols that use proof-of-stake rather than proof-of-work to verify transactions, or the adoption of encryption improvements to make it more quantum-resilient, but ultimately the network effect and price action will dictate which cryptocurrencies win out. So far, that’s Bitcoin. It’s not nearly the fastest cryptocurrency, it’s not nearly the most energy-efficient cryptocurrency, and it’s not the most feature-heavy cryptocurrency, but it’s the most secure and the most trusted cryptocurrency with the widest network effect and first-mover advantage.
Conclusion
How Bitcoin behaves over the next two years, compared to its performance after previous halvings, is a pretty big test for its third halving and fourth overall cycle. We’ll see if it stalls here and breaks down vs the historical pattern, or keeps pushing higher and wider as it has in the previous three cycles.
The outlook for bitcoin price looks very bullish, with several catalysts in its favour and no firm catalyst as to why this cycle should be different than the prior cycles in terms of general direction and shape.

")