
The Bitcoin price is sitting at $3,667 at the time of writing, this is a gain of 0.95% in the last 24 hours. Over $160 million worth of BTC were exchanged in the BTC/USD market representing a 14% share of the global daily volume. The BTC/JPY pair represents an 8% share.
Bitcoin Price Consolidation
The recent consolidation of Bitcoin’s price over the last seven days makes the probability of a drop back to the December lows of $3,100 less likely.
The leading cryptocurrency by market value has been trading in a narrow range of $3,500 to $3,700 since 11 January.
BTC had previously set looked like it was headed for a quick slide toward December lows near $3,100 with a 9 percent drop on Jan. 10 – the biggest single-day decline since 24 November. Prices fell to $3,500 that day, erasing the hard-fought gains of the preceding two weeks.
Despite the sharp bearish reversal, a convincing break below the psychological support of $3,500 has remained elusive for seven days. Therefore, the probability of a drop to December lows has diminished, courtesy of the range bound activity.
As a result, range breakout and a re-test of $4,000 is looking probable. However, as notable crypto trader DonAlt points out it may be wise to stay out of trading this setup at the moment:
“Chilling in the lower part of the current trading range after having put in a few consecutive lower highs. As long as we stay below the POC I’ll most likely stay hedged. I’m personally not interested in trading this trading range. S: ~3380 R: ~3700”
$BTC not so daily update:
Chilling in the lower part of the current trading range after having put in a few consecutive lower highs.
As long as we stay below the POC I'll most likely stay hedged.
I'm personally not interested in trading this trading range.S: ~3380
R: ~3700 pic.twitter.com/9Oo78Dkl8e— DonAlt (@CryptoDonAlt) January 16, 2019
Bitcoins price range could represent bearish exhaustion
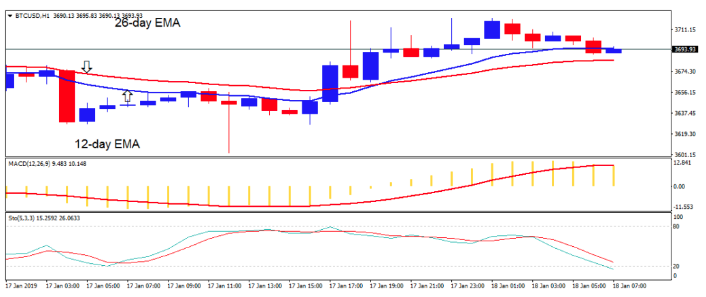
Looking at the 1-hour chart, the price of Bitcoin is in a bullish trend zone. On January 17, the bulls broke the 12-day EMA and the 26-day EMA and reached the bullish trend zone. Bitcoin reached the $3,700 price level but was retracing to a range bound movement above the EMAs.
Meanwhile, the stochastic is out of the overbought region but above the 20% range which indicates that Bitcoin is in bearish momentum and a sell signal. The MACD line and the signal line are below the zero line which indicates a sell signal.
Disclosure: The author holds no cryptocurrency assets at the time of writing.
The views and opinions expressed here do not reflect that of Coindaily.co and do not constitute financial advice. Always do your own research.


Comments are off this post!