
While the entire market seems to be seeing a green light, Bitcoin has suffered the sting of a sideways trend after a short-term bull rally. The price of Bitcoin at the time of writing was $6,420.57, with a market cap of $111.47 billion. The 24-hour trade volume was $4.22 billion.
1 hour
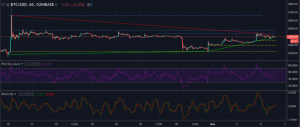
In the one-hour chart, a clear uptrend is visible from $6,183.52 – $6,221.37 – $6,373.49 – $6,392.70. The price broke the support set at $6,415 on November 5 and dropped a bit lower, after which it started picking up. There is a dominant downtrend which can also be seen from $6,659.97 to $6,439.99 and another downtrend ending at $6,407.13.
There are multiple supports set up at points, $6,351, $6,293.01 and a final support set up at $6,221.37. Resistance is set up at $6,439.99 after breaking the previous resistance at $6,413.47. Further resistance points are at $6,478.11 and $6,659.97.
The RSI line is seen hovering over the 50 line, indicating an even pressure from both the sellers and the buyers.
The Relative Vigor Index is demonstrating a bullish crossover as the RVGI line has crossed over the signal line.
1 day
The downtrend in one-day charts is set up in the range of $9,799.99 to 6,423.29, while an uptrend is visible starting from $6,183.52, which breaks up at $6,267.63 and ends up at $6,331.96.
New supports are set up at $6,146.01. If the prices were to break the support, a stronger support is set up at $5,851.66.
A short-term resistance is $6,524.56, and the subsequent resistance points are set up at $6,750, $7359.99, $8,385.50, and $9,799.99.
Although an uptrend is visible, the Parabolic SAR markers are above the price candles, indicating a bearish market.
The MACD indicator is crossing over the signal line, indicating a bullish move for Bitcoin in the near future.
The Stochastic line has crossed over the signal line, demonstrating a bullish market.
The RVGI indicates a bullish move while RSI is showing a neutral stance. The Parabolic SAR indicator is showing a bearish market trend, while MACD and Stochastic indicators are showing a price hike due to bullish crossovers.


Comments are off this post!