
As we anticipate the bull market returning, we are quickly put back in our place by the bears. Further declines are more daunting than ever at this stage, there is a lot of uncertainty in cryptocurrency right now.
Straight off the bat we can see throughout the first major cycle the overall increase was roughly 52,000% (Not mentioned on the chart, this is highlighted in other analysis mentioned above) and the decrease was 87% which lasted 413 days.
This was broken up by two main intermediate cycles measuring a decline of 81% and 82%.
In the current market cycle, the increase measured at 10,000% or 13,000% (depending on which low you are measuring from in 2015) and the decrease still stands at an overall 70% from $20,000 to $5,900. Price is currently trading above this level at $6,460 which is my primary concern, the daily support trendline has been lost and further downside is likely.
Taking a look at the daily chart below the expected overall decline is 80% based upon the weekly support trendline and key daily zone.
At this point in time, a recovery is more than possible. I will be focusing on the 1h, 4h and daily timeframes to predict where price is likely to move next.
If price breaks the low at $5,900 we will see further downside.
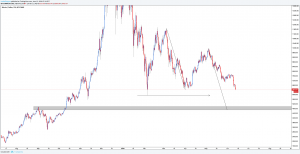
On the 12h chart below I have highlighted the structure I will be focusing on to capitalise on the drop, this is just below $5k.
Credit: Lewis Glascow


Comments are off this post!